git-art.
Paint pixel art onto a GitHub-style contribution grid, then export a ready-to-run bash script of backdated commits to make it real. Live at git-art.net.
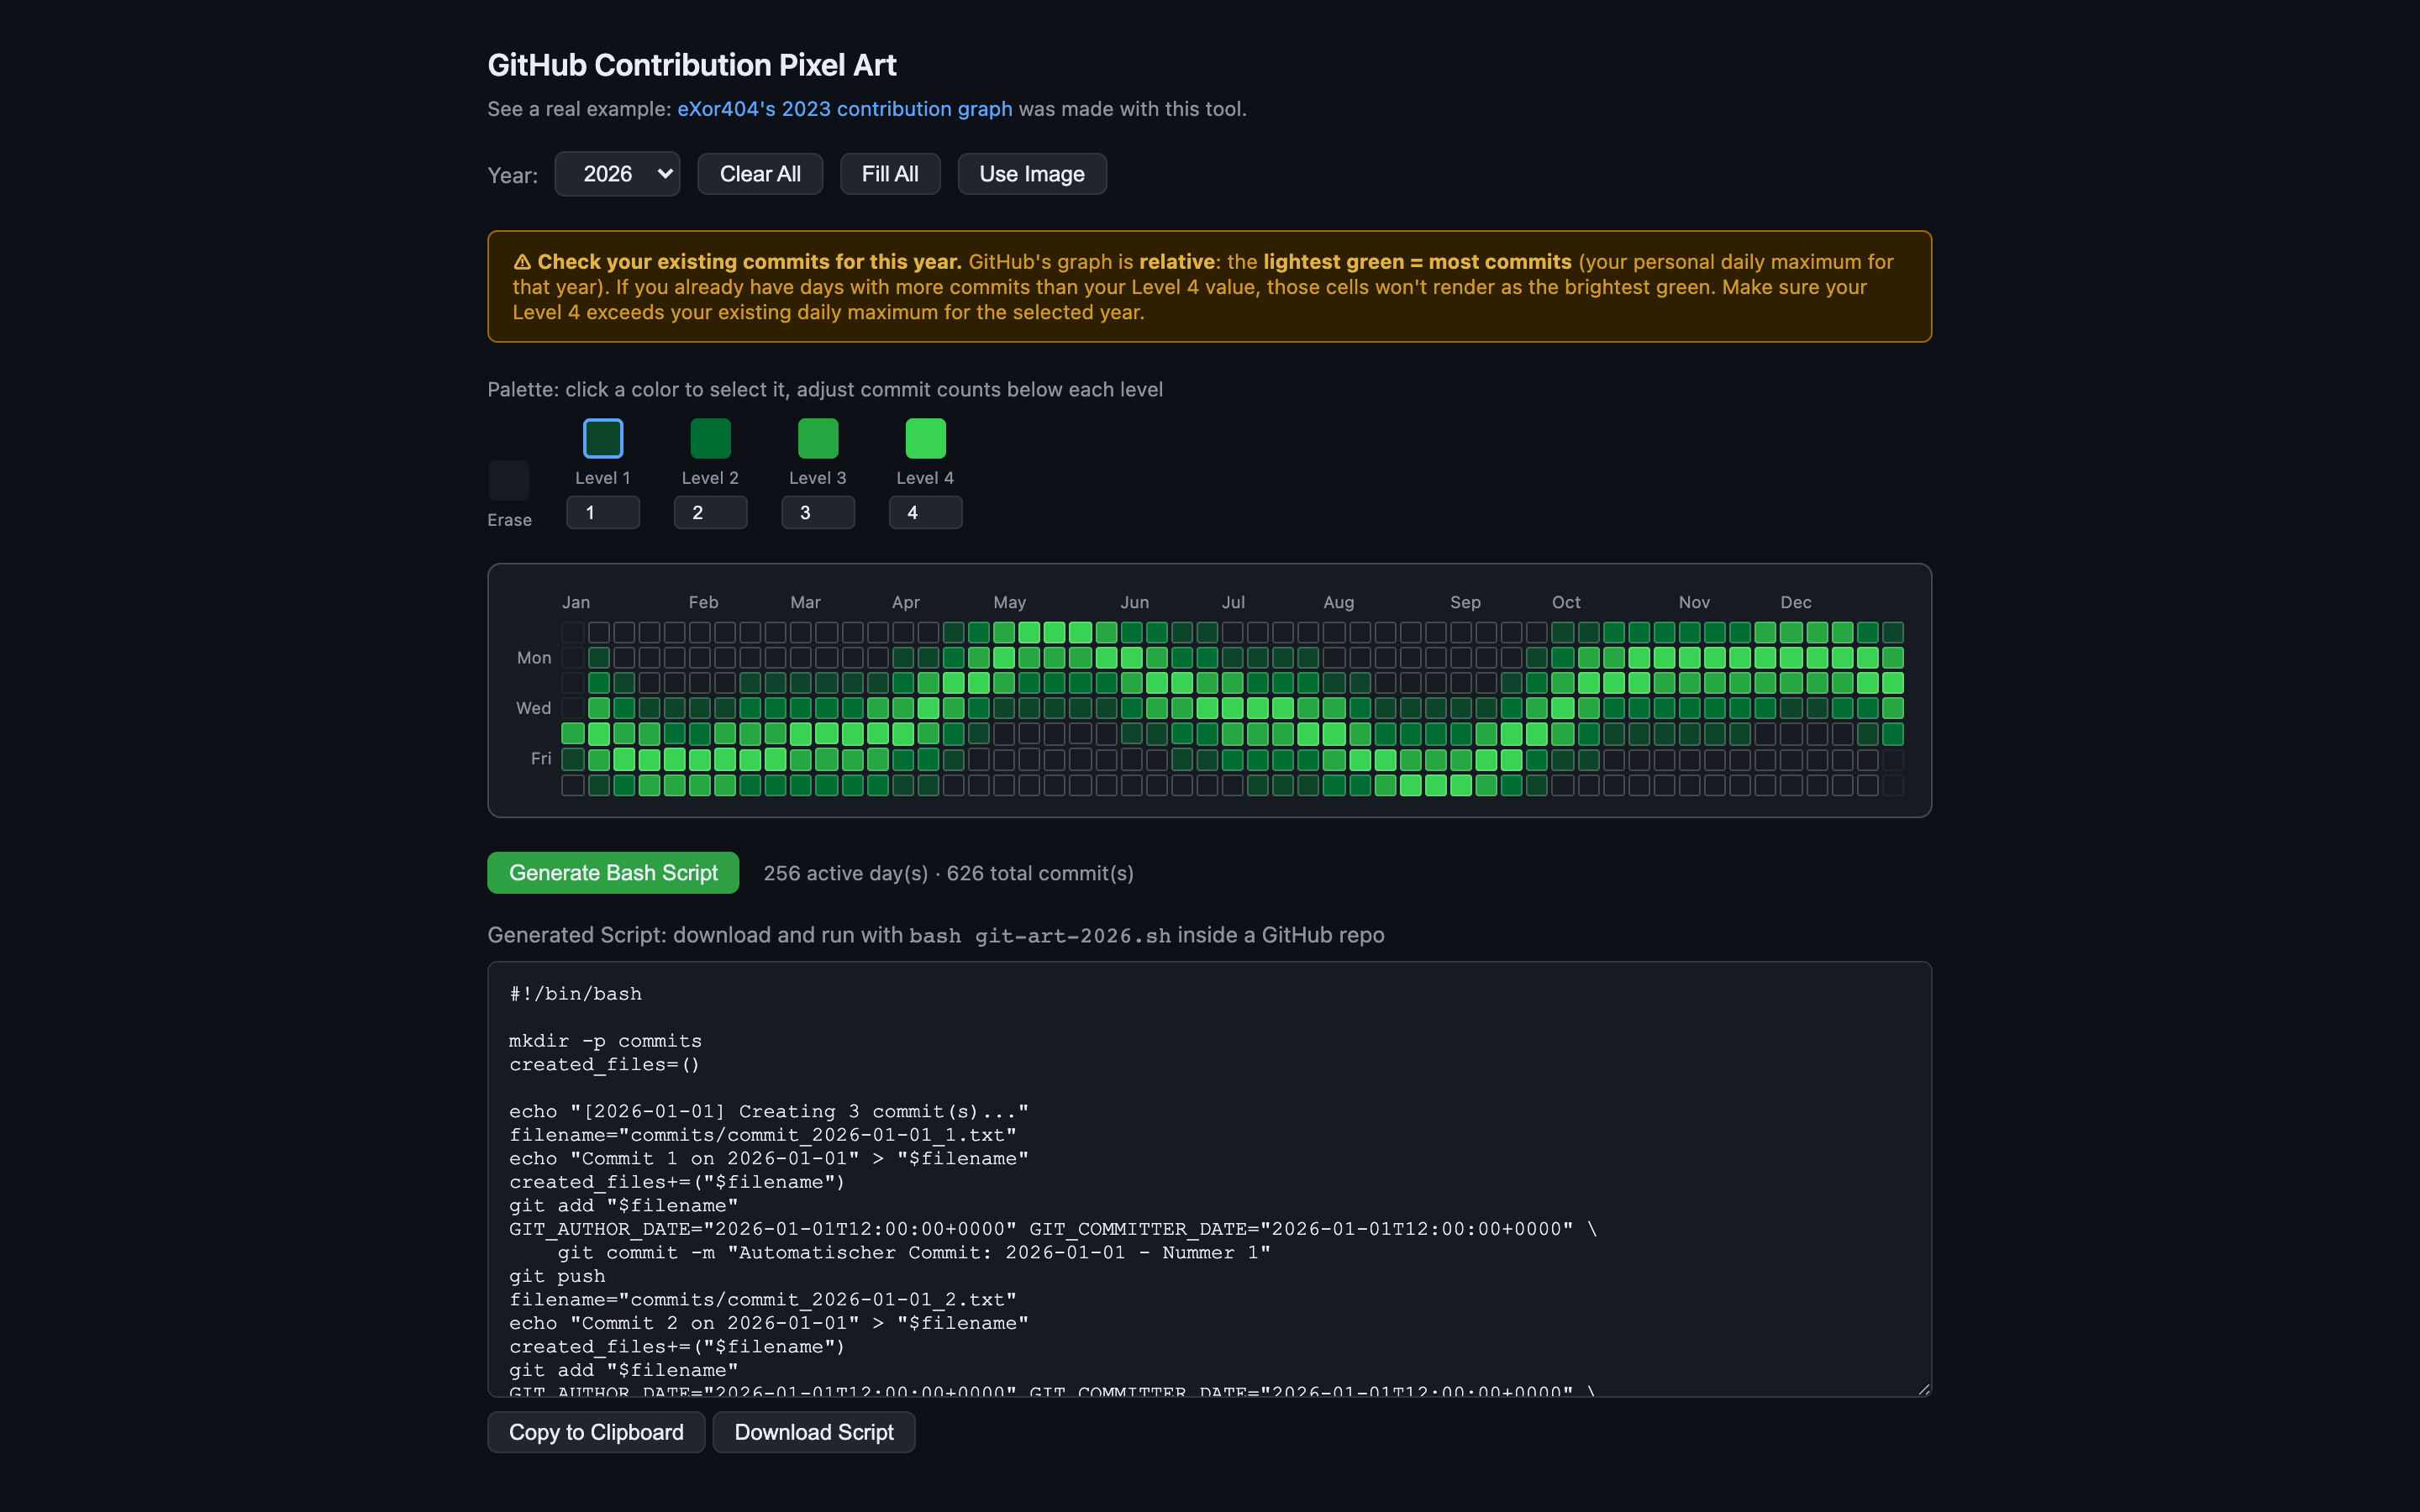
git-art is a single-file web tool that turns a GitHub contribution graph into a canvas. You paint pixel art onto a GitHub-style grid, or drop in an image and watch it quantize to the five-level green palette, then export a ready-to-run bash script of backdated commits that reproduces the artwork on a real profile. The entire app is one 774-line HTML document with zero runtime dependencies, deployed as a Docker image and live at git-art.net.
The whole application lives in one self-contained HTML file. Markup, CSS, and vanilla JavaScript ship together with no framework, no bundler, and no build step. The only dependency anywhere in the project is npx serve, used purely to host the static file. This keeps the surface area tiny and the thing trivially portable, which is why the Dockerfile is six lines and the app runs the same locally, in a container, and in production.
The interesting work is in the calendar math. The grid is reconstructed exactly the way GitHub lays it out: it walks back from January 1 to the preceding Sunday, computes the real number of weeks for the chosen year, and maps every cell to a concrete date with helpers for which cells fall inside the year and where each month label belongs. Cells outside the year are dimmed and inert. A year selector spans five years back to two years forward, rebuilding the grid and its month and weekday labels on every change. Painting is a drag-aware mousedown plus mouseenter loop with a five-step palette that mirrors GitHub's dark-theme greens.
Image import is a small image-processing pipeline on a hidden canvas. An uploaded or dropped image is fit to the grid aspect ratio, then positioned and scaled with a directional crop pad and a size slider. The visible cell area is drawn into an off-screen canvas sized to the grid, sampled per cell, and converted to one of five levels using a luminance formula (299/587/114 weighting) with an optional invert and full alpha handling so transparent regions read as empty. A live pixelated preview renders the result before it is stamped onto the real grid.
Export turns the grid into a deterministic bash script. Painted cells are collected, filtered to in-year dates, sorted chronologically, and emitted as per-day commit loops that set GIT_AUTHOR_DATE and GIT_COMMITTER_DATE to backdate each commit, with configurable commit counts per color level so the brightest green can be pushed above the user's existing daily maximum (GitHub's graph is relative). The script tracks every file it creates and cleans them up with a final git rm commit, so the artwork stays but the scaffolding does not. Output can be copied or downloaded as git-art-YEAR.sh. CI builds and pushes a Docker image to GHCR and, on tags, SSH-deploys it to the server.